
一、初识Graphviz
1.1 简介
GraphViz是一个开源的图像可视化的软件,是贝尔实验室开发的一个开源的工具包,它使用一个特定的DSL(领域特定语言):dot作为脚本语言,然后使用布局引擎来解析此脚本,并完成自动布局。graphviz提供丰富的导出格式,如常用的图片格式,SVG,
1.2 环境搭建
结合sublime Text插件实时编译预览
使用
shift+command+p,输入搜索选中Package Control: Install Package,然后输入GraphViz,然后安装GraphVizPreview即可,安装完成后,只要全选中代码,然后按shift+command+g就可以预览了。
- 其实也可以直接用
brew安装GraphViz,但是每次要敲命令行,太麻烦了
mac下执行
brew install graphviz |
终端编译代码
dot test.dot -T png -o test.png
二、使用
Graphviz支持两类图:无向图(graph,用“- -”表示节点之间)和 有向图(digraph,用“->” 表示节点之间)。graphviz包含3中元素,图,顶点和边。每个元素都可以具有各自的属性,用来定义字体,样式,颜色,形状等
GraphViz中包含多种布局
dot默认布局,用于有向图neato基于spring-model算法(force-based)twopo径向布局circo圆形布局fdp用于无向图
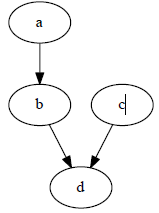
2.1 第一个graphviz图
digraph abc{ |
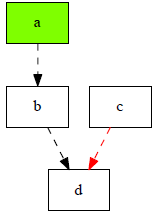
定义顶点和边的样式
digraph abc{ |

进一步修改顶点和边样式,将顶点
a的颜色改为淡绿色,并将c到d的边改为红色
digraph abc{ |
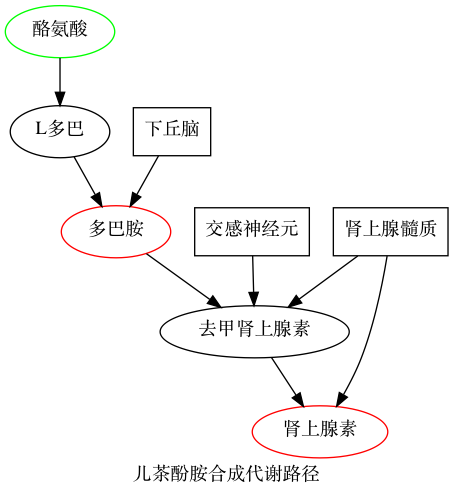
其他例子
digraph demo{ |
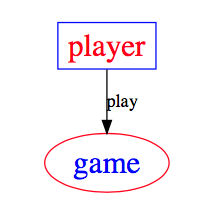
2.2 带标签
digraph { |
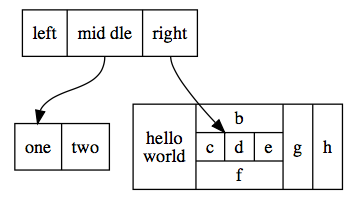
2.3 子视图
digraph { |
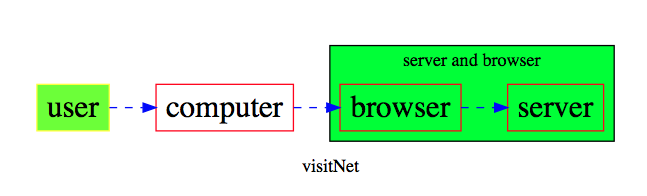
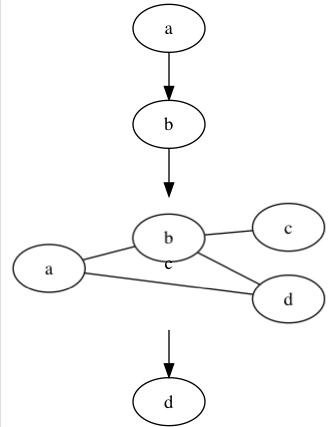
2.4 结构视图
digraph { |
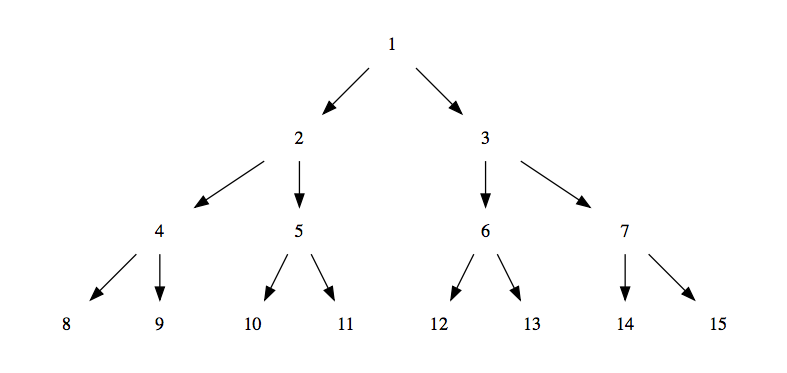
2.5 树形结构
digraph tree { |
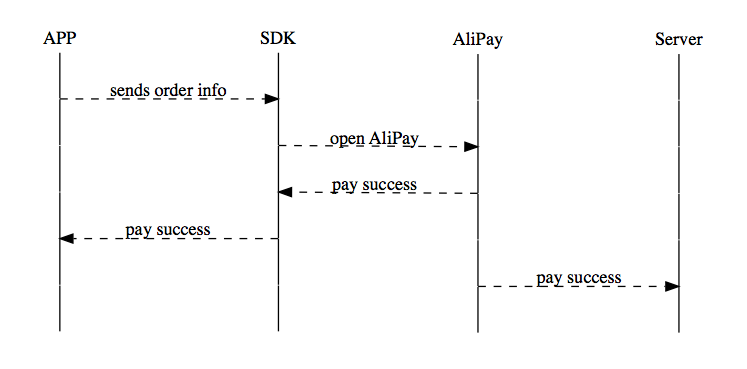
2.6 时序图
digraph time { |
2.7 一个hash表的数据结构
hash表内容
struct st_hash_type { |
脚本如下:
digraph st2{ |

2.8 模块的生命周期图
digraph module_lc{ |

2.9 简单的UML类图
digraph G{ |

2.10 有限状态机
digraph finite_state_machine { |

三、语法
3.1 图像属性
label="My Graph";给图像设置标签rankdir=LR; 将图片由原来的从上到下布局变成从左到右布局{rank=same; a, b, c }将一组元素放到同一个levelsplines="line"; 让边框变为直线,没有曲线和锐角K=0.6; 用来在布局中影响spring属性,spring属性可以用于将节点往外推,这个在twopi和sfdp布局中很有用。
3.2 交点属性
[label="Some Label"]给交点打标签[color="red"]给交点上色[fillcolor="blue"]设置交点的填充色
3.3 边的属性
[label="Some Label"]给边设置标签 (设置路径权重的时候很有用)[color="red"]# 给交点上色 (标示路径的时候很有用)[penwidth=2.0]# 给边适配厚度,标示路径的时候很有用。
3.4 尺寸, 背景颜色
fixedsize=true;size="1,1";resolution=72;bgcolor="#C6CFD532";
四、一些技巧
4.1 插入图片
digraph { |
注:需要用命令行
dot test.dot -T png -o test.png生成,前提是用brew安装了GraphViz
4.2 统一节点和连线
digraph { |